Google Search Console is usually treated as a problem-fixing tool. Indexing errors. Coverage issues. Manual actions.
That approach misses the bigger opportunity. For client reporting, Google Search Console is one of the best tools you have for explaining search visibility in plain language. It shows what Google is showing, how that changes over time, and where performance is improving or slipping. It’s my SEO Measurement go-to!
This guide explains how to use Google Search Console as a visibility dashboard for client reports, not just a technical alert system.
What clients actually need from an SEO visibility report
A good client-facing SEO report should answer three simple questions:
- What pages and topics are getting visibility
- Whether that visibility is growing or declining
- Where Google seems confused or uncertain
Search Console already answers all three. The key is pulling the right views and explaining them clearly.
My big GSC Productivity hack to find patterns👀
Instead of relying only on summary metrics, this approach pulls day-by-day organic visibility data over longer windows (monthly, quarterly, semi-annual, or yearly) to surface trends, inflection points, and opportunities that are invisible in rolled-up reports.
Put simply, instead of looking only at high-level totals, this approach looks at search visibility day by day over longer periods (monthly, quarterly, semi-annual, or yearly) to clearly show what is improving, what is slipping, and where new opportunities are forming.
How to do it:
Step 1: Pull GSC Data
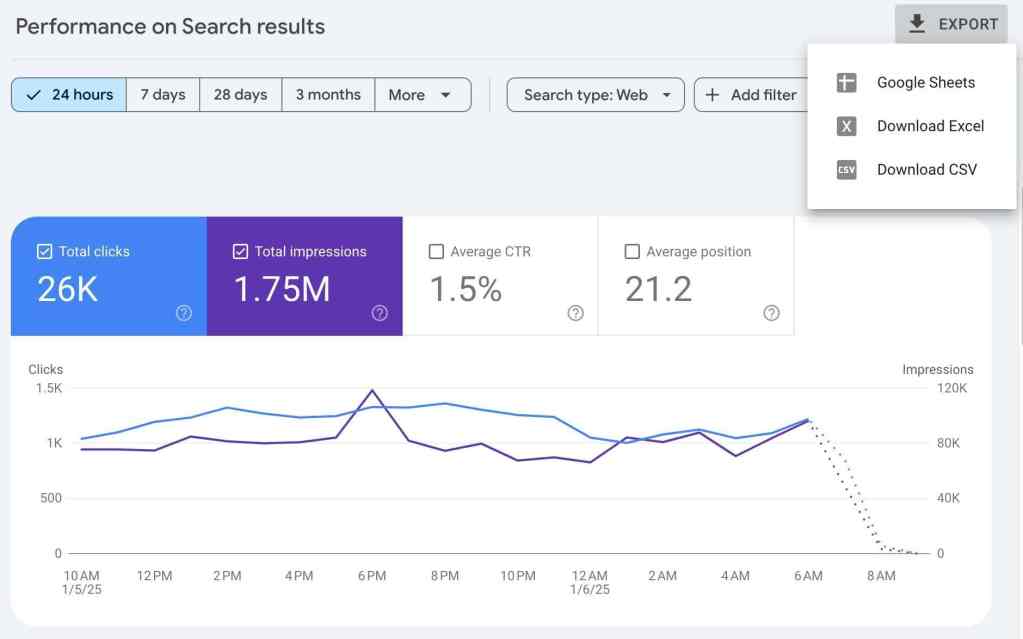
- Go to Google Search Console, open the performance report
- Set the date range to pull day-to-day data from the exact window you need (monthly, quarterly, semi-annual, yearly, custom)
- Export the report – use the export button at the top to pull data into sheets or excel
- Organize the data how you’d like, or add more data if you are doing this from multiple tools (GA4, Ahrefs, etc.)
Step 2: Analyze with AI
- Paste the day-by-day dataset into an AI tool
- Prompt it to analyze organic SEO visibility trends across the full timeframe
- Ask it to identify patterns, spikes, drops, and sustained movements
- Have it calculate percentage increases and decreases between meaningful periods
- Tip: The more you prompt for what you want, and the more you add as far as specific goals, expectations, and things you’re looking for, the better you will be.
Step 3: Control the Result
Specify whether the summary should be client-facing, internal, technical, or strategist-facing, depending on what you’re using it for
Note: Client-facing will focus on clear progress, wins, and great plain language
Why This Works
- Day by day data exposes momentum, volatility, and turning points that averages hide
- Longer windows reveal whether gains are durable or just short-term noise
- Percent change adds clarity and defensibility in conversations
How You Can Use it
- QBRs and executive readouts
- Live client calls and stakeholder meetings
- Compiling wins tied to specific actions or launches
- Identifying problem areas early, before they show up in summary reports
- Finding growth opportunities worth doubling down on
If this is helpful and works for you, let me know in the comments below! Or comment on your own tips that I can try!
Now, let’s talk about each type of GSC report and how to use them.
Performance report: your main visibility chart
The performance report should be the foundation of most client reports.
Impressions mean Google is showing your site. Clicks mean users are choosing it. The position shows how competitive that visibility is over time.
For client reporting, focus on trends, not exact numbers.
Pull pages with high impressions but low clicks. These pages are being shown in search, but users are not choosing them. This usually points to issues with titles, descriptions, or a mismatch between the page intent and the search intent.
Next, highlight pages where impressions are increasing. Even if clicks have not increased yet, this shows growing visibility and early momentum, which clients clearly understand as progress.
Pay close attention to pages where impressions decline before clicks drop. This is an early warning signal and helps explain traffic decreases before they happen.
Always group performance data by page rather than by keyword. Pages are easier for clients to understand and tell a clearer story, while keyword lists often create confus
Pages report: showing what Google cares about
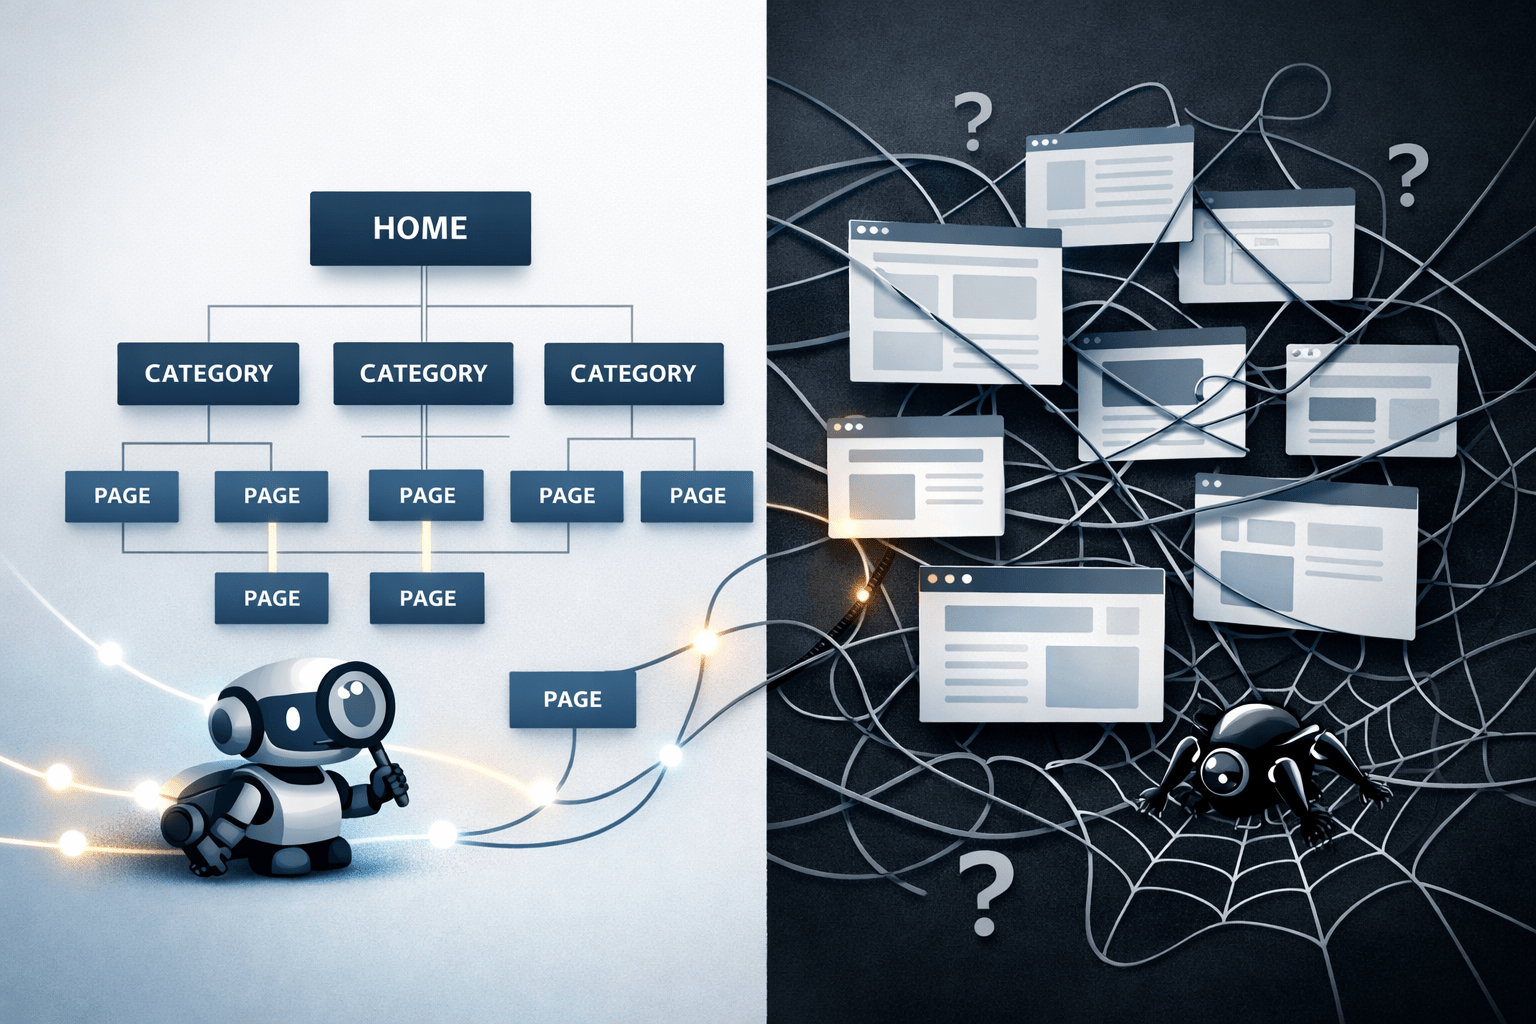
The Pages report helps explain which URLs Google considers important.
Use this in reports to show pages that are gaining visibility unexpectedly, pages that lost visibility after a site change, and similar pages that perform very differently.
When two similar pages behave differently, it is usually not about writing quality. It is often internal linking, page placement, or structure. This helps move the client conversation away from “we need more content” and toward smarter site decisions.
Indexing report: explaining visibility limits
Clients often ask why certain pages are not ranking. The Indexing report helps answer that.
Pull pages that are crawled but not indexed. This usually means Google does not see enough value or sees overlap with other pages.
Pull pages indexed that were not intentionally submitted. This can reveal discovery paths the site owner did not expect.
Watch big changes in indexed page counts. These often explain visibility shifts before traffic changes show up. You do not need to show errors. You need to explain what Google is choosing not to show and why.
Experience reports: stability, not rankings
Core Web Vitals and experience metrics are best used as supporting context in client reports.
Use them to confirm that visibility drops are not caused by performance issues, show that new templates did not introduce instability, and separate content relevance problems from usability problems. Avoid framing these as pass or fail scores. Clients care more about consistency than perfection.
Using time comparisons clients understand
Time comparison is where many reports fall apart. Compare before and after major changes. Use the same pages across both time ranges. Avoid week-over-week views unless explaining short-term testing. Clients understand patterns. They do not need daily fluctuations.
Turning Search Console into a client-ready dashboard
To use Search Console effectively for reporting, pull data regularly, not only when traffic drops.
Combine Performance, Pages, and Indexing insights. Explain changes in visibility before explaining traffic. Use charts and simple language instead of SEO jargon. When framed correctly, Search Console tells a clear story about progress and priorities.
Final takeaway
Google Search Console is not just a technical tool. It is one of the clearest ways to explain SEO visibility results to clients. When you focus on impressions, page-level trends, and indexing signals, you can show how visibility is changing and why. That turns reports into explanations, not excuses, and builds trust over time.
👍1❤️1👏0🎉0🙏0😢0
Google Search Console SEO Reporting FAQ
What is Google Search Console used for in SEO client reporting?
Google Search Console helps SEO professionals show how a site is performing in search results. For client reporting, it visualizes what pages are getting visibility, whether that visibility is increasing or decreasing, and where Google may be confused about a site’s content.
How can I use Google Search Console to track SEO visibility over time?
Set a custom date range in the Performance report and export day-by-day data. By analyzing trends across months or quarters, you can reveal momentum, drops, or emerging patterns that average metrics hide.
Why should I focus on impressions in client SEO reports?
Impressions show when Google displays your page in search results. Highlighting pages with high impressions but low clicks helps identify intent mismatches. It also signals areas with untapped potential before traffic changes occur.
What are the most important Google Search Console reports for client visibility?
Use the Performance report to show impressions, clicks, and ranking trends. The Pages report highlights which URLs are gaining or losing visibility. The Indexing report helps explain why certain pages don’t show up in search.
How do I explain a drop in visibility to a client?
Look at declining impressions in the Performance report first. Then check the Indexing report for crawling or indexing issues. Show before-and-after comparisons around site changes to provide context with clarity, not blame.
Can I use AI to analyze Google Search Console data?
Yes. Export day-by-day GSC data into a spreadsheet, then use AI tools to find spikes, drops, trends, and inflection points. AI can summarize performance shifts and calculate percent changes across defined periods, saving time and enhancing insights.
What timeframe should I use in client-facing GSC reports?
Monthly, quarterly, or semi-annual ranges work best. Avoid weekly views unless reporting on recent tests. Always compare like-for-like pages or periods to show clear trends clients can understand.
How can I show progress even if traffic hasn’t increased yet?
Highlight increasing impressions or improved rankings. These early signals show that SEO work is gaining visibility, even before users start clicking more. This builds trust and sets proper expectations with clients.
What does it mean if Google is crawling but not indexing a page?
This usually means Google doesn’t find the page valuable, or it’s too similar to other content. Use this insight to prioritize technical fixes, improve content differentiation, or adjust internal linking strategies.
How do I turn Search Console into a client-friendly dashboard?
Pull data consistently, not just when problems happen. Combine visibility insights from multiple reports. Use charts and plain language to tell the story behind the data. Avoid SEO jargon and focus on trends and progress.


Join the conversation!