Case study · One of my own sites
WireRef: growing on Bing after Google dropped it
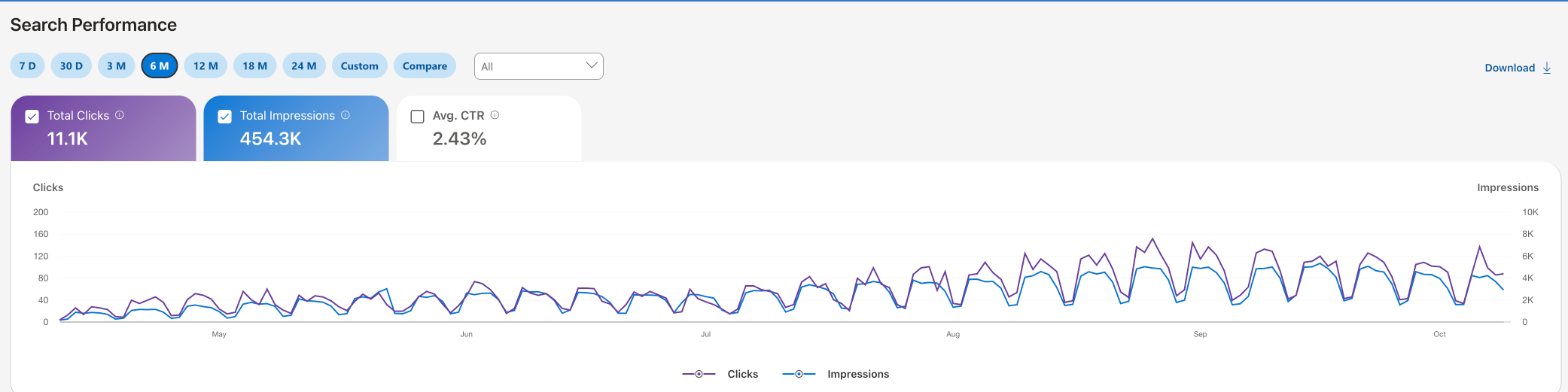
Google almost stopped showing WireRef, my free NEC wiring reference for electricians, in a single day in March 2026. Bing grew it instead, from 655 clicks in April to 2.8K in September.
- 2.8KBing clicks in September, up from 655 in April
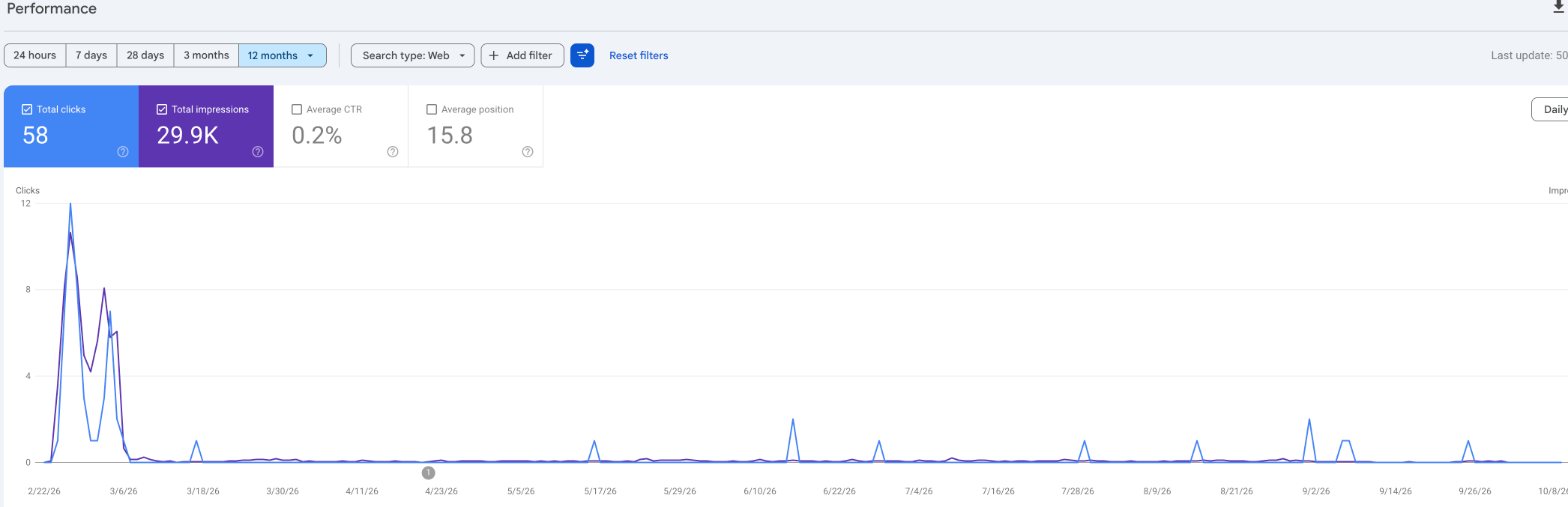
- 243Google impressions on March 6, down from 2.3K the day before
- 11Google clicks in six months, April to September
The whole site, month by month
The last 28 days for WireRef: fell on Bing. Google 4 to 1, Bing -11%.
- September vs August+2%2.8K search clicks, from 2.8K
- Last 28 days vs the 28 before-11%2.4K search clicks, from 2.7K
- Jul to Sep vs Apr to Jun+138%7.4K search clicks, from 3.1K
- 655Apr
- 1.1KMay
- 1.3KJun
- 1.7KJul
- 2.8KAug
- 2.8KSep
Why did Google drop WireRef?
The fall happened in one day: from Mar 5 to Mar 6, 2026, daily Google impressions went from 2.3K to 243. Search Console records the change; it does not say what caused it, and nothing in these numbers isolates a single reason.
So the real question was a practical one: how does a reference site keep reaching people when Google stops sending them?
What WireRef does for an electrician
The National Electrical Code is public.
The values are public, spread across code tables and state adoption records. WireRef puts them where a person on a job looks first: the wire size for a circuit, the ampacity of a gauge, the rules in their state, the breaker for an appliance. Three calculators do the arithmetic.
On the live site: 50 state code pages, 62 appliance wiring guides, 35 project guides and 519 URLs in the sitemap.
Counted on the live site, 2026-10-11: menu labels and sitemap.
Bing did the growing, then leveled off
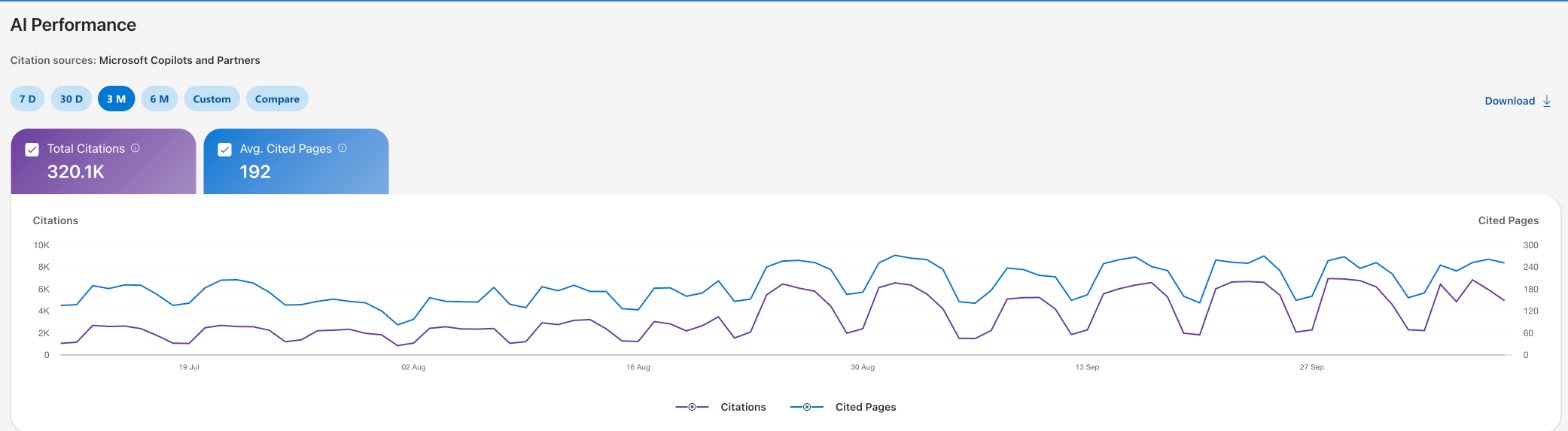
Bing sent 655 clicks in April and 2.8K in September, while Google sent 11 in the same six months. The report above shows every month.
Is Bing still growing? Not lately. August and September were close (2.8K and 2.8K clicks), and the weekly count has dropped since late August.
- 2026-08-21 to 2026-08-27
- 737
- 2026-10-02 to 2026-10-08
- 570
Bing clicks over seven days. The first week is the highest in the August to October stretch; the second is the latest complete week.
How I measured it. Google Search Console daily impressions and clicks; Bing Webmaster Tools clicks summed by full month. Pulled 2026-10-10 and 2026-10-11. My Bing archive starts on March 27, 2026 for every site, so there is no Bing baseline from before the drop. The Bing growth that followed is real in the data. Whether it would have happened anyway is something these numbers can't answer.
What I wrote five days before the drop
My first WireRef case study went up on March 1, 2026. Its page counts can't be confirmed today, so they are not repeated here. The lines below are quoted from it as written.
Every site I build teaches the next one.
The pattern of mistakes shifted from “did not plan this” to “planned it but underestimated the maintenance cost.” That feels like progress, but I am not done making mistakes here.
The mistakes are getting less fundamental. That is the only pattern I am confident about. I am sure the next project will teach me something I do not know yet.
From my WireRef case study, published March 1, 2026.
The evidence
Heatmap, WireRef
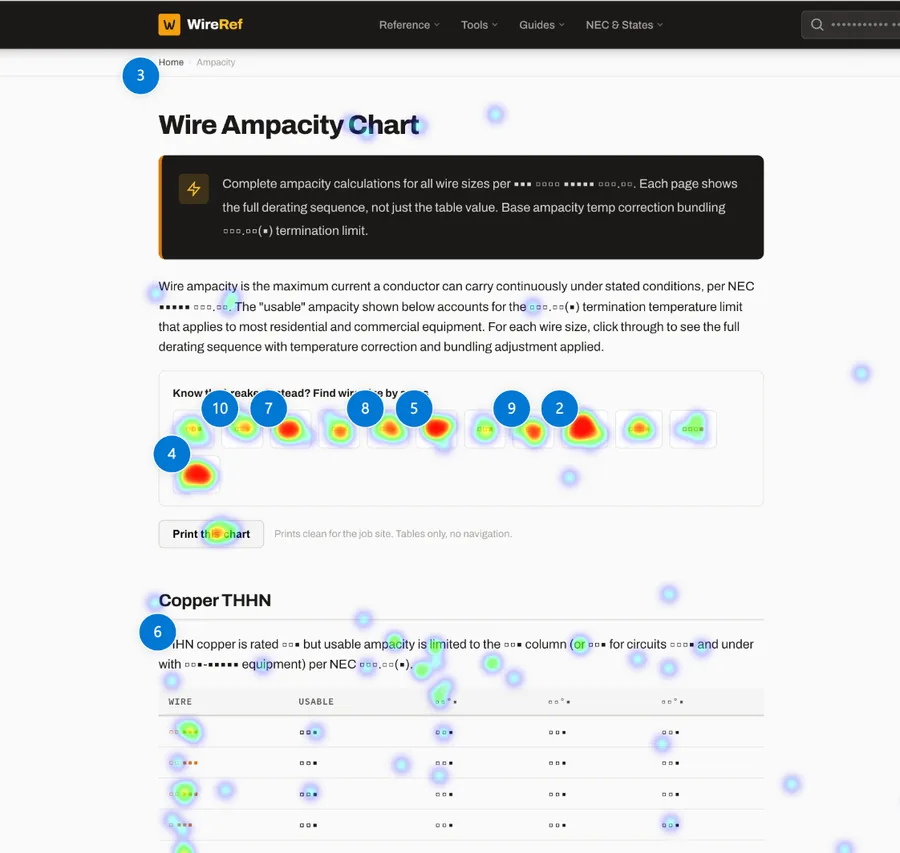
Electricians reach for the breaker shortcut first
1K page views, 308 clicks on desktops, last 30 days
On the ampacity chart, the hottest spots on desktop are the buttons that find a wire size from the breaker amps, which sit above the full table. My read: people arrive knowing their breaker, not their wire, so the shortcut belongs first.
Microsoft Clarity click heatmap, /ampacity/, captured 2026-10-12
Receipt · WireRef
Receipt · WireRef
Receipt · WireRef